 Artificial Money Supply Inflation with the USE OF REPOs (Repurchase Agreements), very similar to the Federal Reserves purchase of Acceptances during the 1920s...And its effect on the markets.
M3=M2+CDs+Eurodollars+REPOs (the biggest portion by far)
M2= M1+Savings Accts+Money Mkt Accts+Small Time Deps+CDs (under $100,000)
 * And GDP

* A debt financed revolution, 1980-2006 total debt in US to GDP goes from 140% (in 1980) to 285% (in 2006), approx. Of which federal gov proportion drops from 20% to 13%, meaning the Federal Reserve member banks benefit from very fast growing consumer (and therefore other financial sector) indebtedness
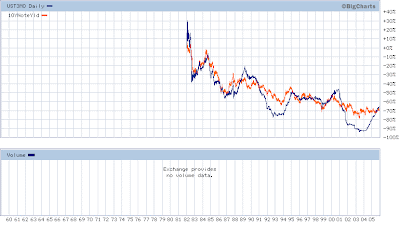
* The excess money finds its way to the "far from consumer" industries making up the "High Order sectors of production", in this case the S&P 500 index compared to the 10-yr Note interest rate . 9/22/1985, The Plaza Accord is signed=5 major industrialized countries agree to depreciate the Dollar v. the Yen & Mark (causes the Japanese asset price bubble of the late 1980s (& helped with the US's in the 1990s))
*Here is the Dow Jones industrial average, Note Chart number 1 (above) shows M3, well the private equity and hedge fund industries used REPOs to finance their stock market activities...increasingly after 1999' crash, Greenspan stated is objective of "spreading liquidity", and look at the volume portion of this chart following its employment.
In 2006 the Federal Reserve stopped publishing (and measuring) M3 because they said it's cost out weighs its benefit, saying that the velocity of money, the rate at which money transfers hands, takes precedence over needing to maintain the money supply to the time preferences of the public, i.e. the savings-consumption rates of the economy. Regardless to the fact that the Federal Reserve and its 21, hand picked, primary dealers make up nearly all of the velocity. As did the Federal Reserve and member banks did in the 1920s and 30s.


0 Comments:
Post a Comment
Subscribe to Post Comments [Atom]
<< Home